Reading your child's score report
MAP Growth scores explained: what a RIT score and a percentile actually mean
NWEA moved the proficiency bar in 2025, and it moved a long way. A child at the national average now sits below it in most states. Here is how to read a MAP Growth report, and what the number is really telling you.
The bar moved, and nobody sent a letter about it
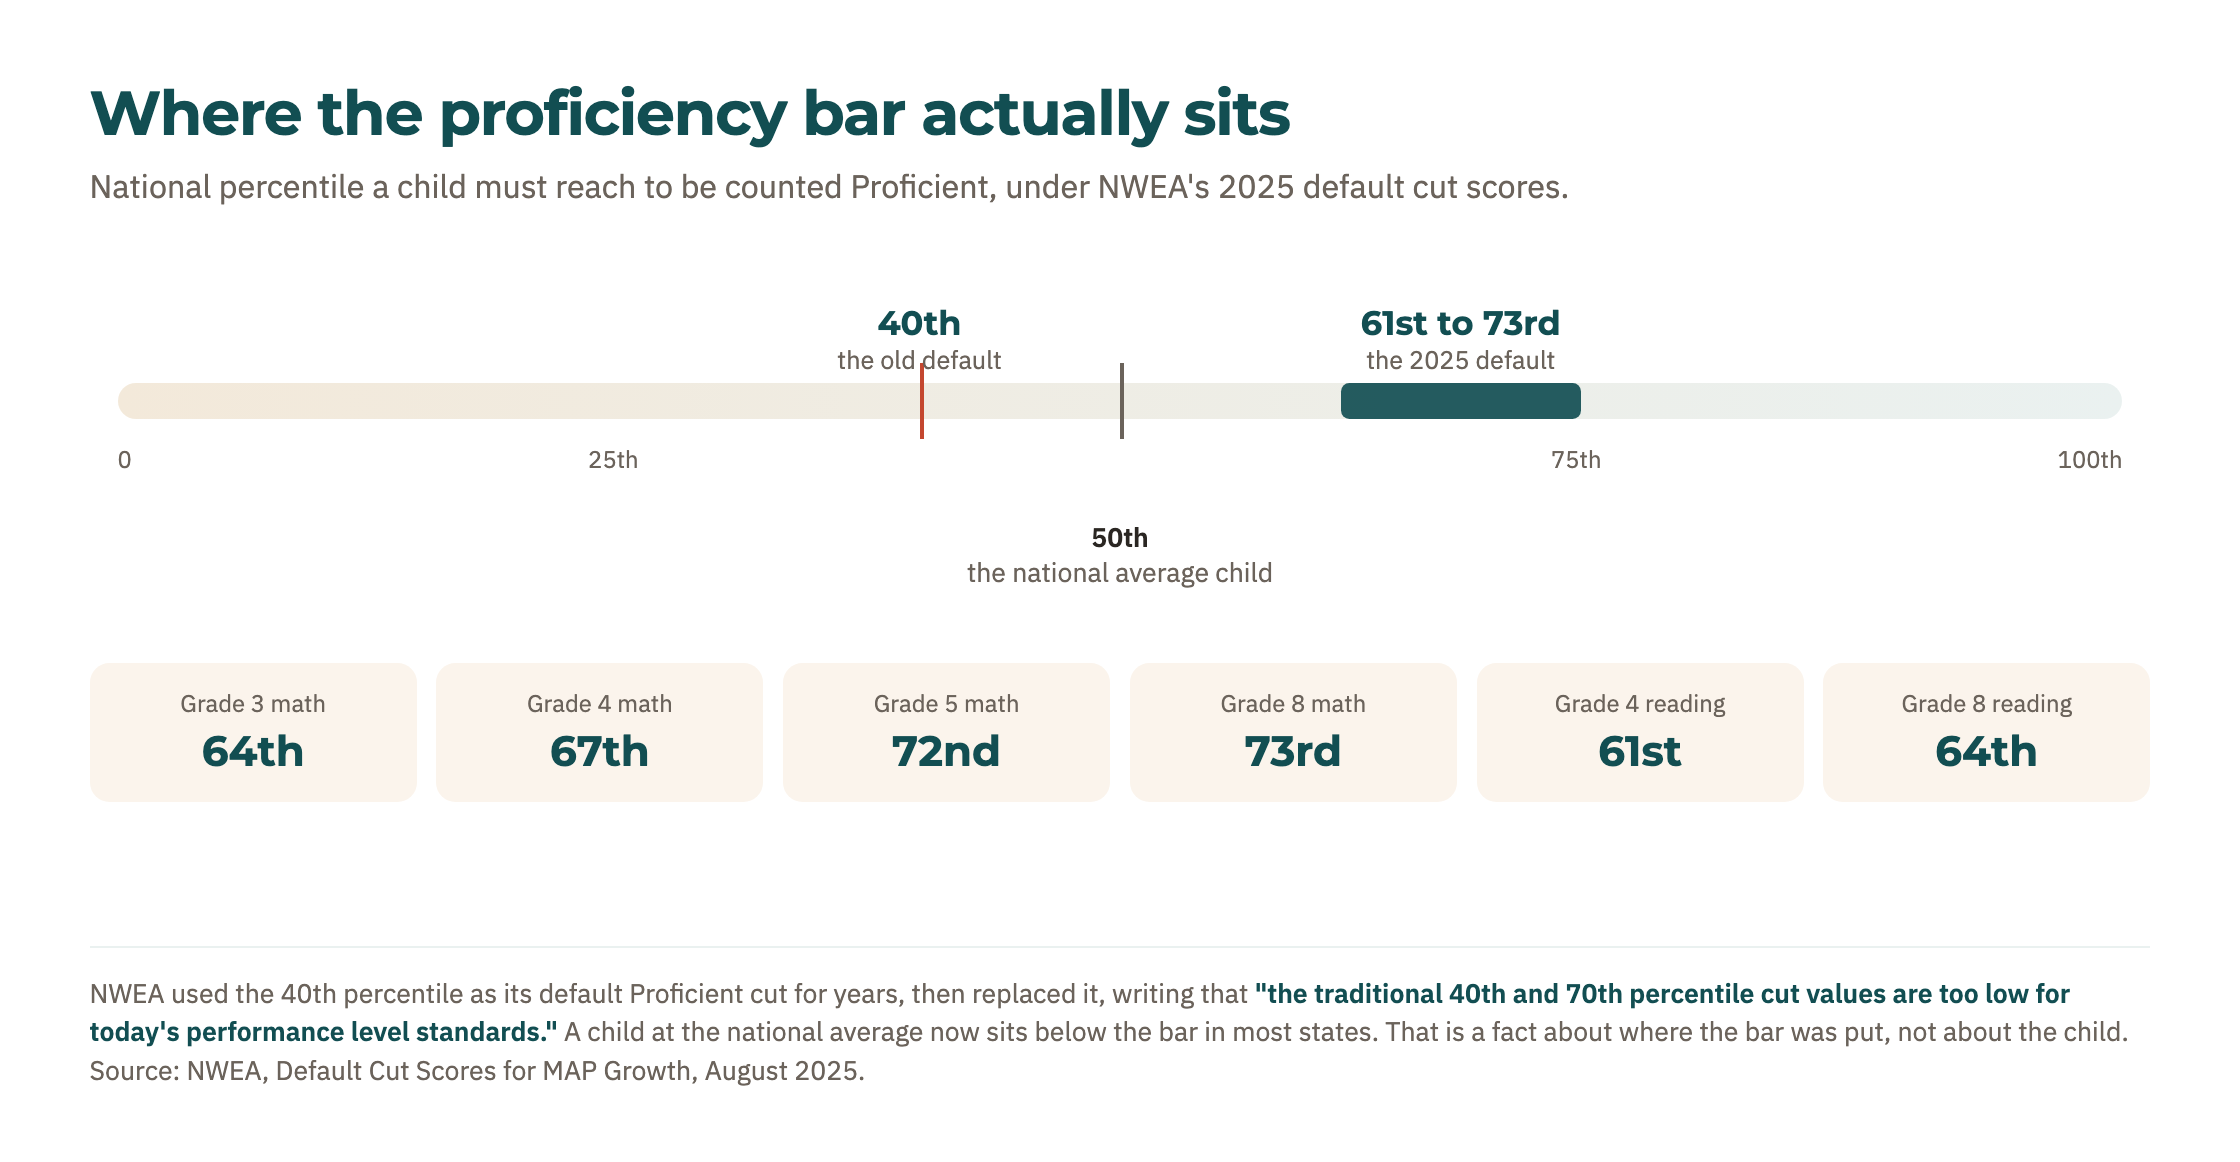
For years NWEA applied a simple default when a district had no linking study of its own: the 40th percentile for Proficient and the 70th for Advanced. In August 2025 it replaced those defaults, derived from 36 linking studies across 41 states, and explained why in one blunt sentence.
the traditional 40th and 70th percentile cut values are too low for today’s performance level standards
NWEA, Default Cut Scores for MAP Growth Mathematics and Reading Assessments, August 2025
The consequence is worth stating plainly, because it changes how you should read your child’s report. Proficient now begins somewhere between the 61st and 73rd percentile. The child sitting exactly at the national average, the 50th percentile, the middle of the pack, is below the proficiency bar in most states. That is a fact about where the bar was placed. It is not a fact about the child.
The actual numbers, by grade
These are NWEA’s default cut scores, published August 2025, applied automatically when a district has no linking study of its own. They cover grades 3 to 8.
Mathematics
| Grade | Proficient RIT | Percentile | Advanced RIT | Percentile |
|---|---|---|---|---|
| 3 | 205 | 64th | 218 | 87th |
| 4 | 218 | 67th | 232 | 89th |
| 5 | 227 | 72nd | 240 | 90th |
| 6 | 230 | 70th | 244 | 90th |
| 7 | 234 | 70th | 248 | 89th |
| 8 | 241 | 73rd | 256 | 91st |
Reading
| Grade | Proficient RIT | Percentile | Advanced RIT | Percentile |
|---|---|---|---|---|
| 3 | 201 | 65th | 214 | 87th |
| 4 | 207 | 61st | 219 | 83rd |
| 5 | 213 | 61st | 225 | 83rd |
| 6 | 217 | 62nd | 230 | 86th |
| 7 | 221 | 64th | 234 | 87th |
| 8 | 224 | 64th | 238 | 88th |
What a RIT score actually is
RIT stands for Rasch Unit. Three properties make it different from a percentage or a grade.
- It is equal-interval. The distance between 200 and 210 means the same thing as the distance between 230 and 240. Most school marks do not behave this way.
- It does not reset. The scale is independent of grade and age, so a RIT from grade 3 and a RIT from grade 6 sit on the same ruler. That is what makes growth measurable rather than merely asserted.
- It is not a pass mark. There is no failing RIT. The score says where the child is now, which is a different question from whether that is good enough.
Children usually sit MAP Growth three times a year, in autumn, winter and spring. Autumn is normally the lowest of the three and spring the highest, and typical growth between terms runs somewhere around two to eight RIT points depending on grade and subject. A single term’s movement inside that band is noise as often as it is news.
Why your child said the test was too hard
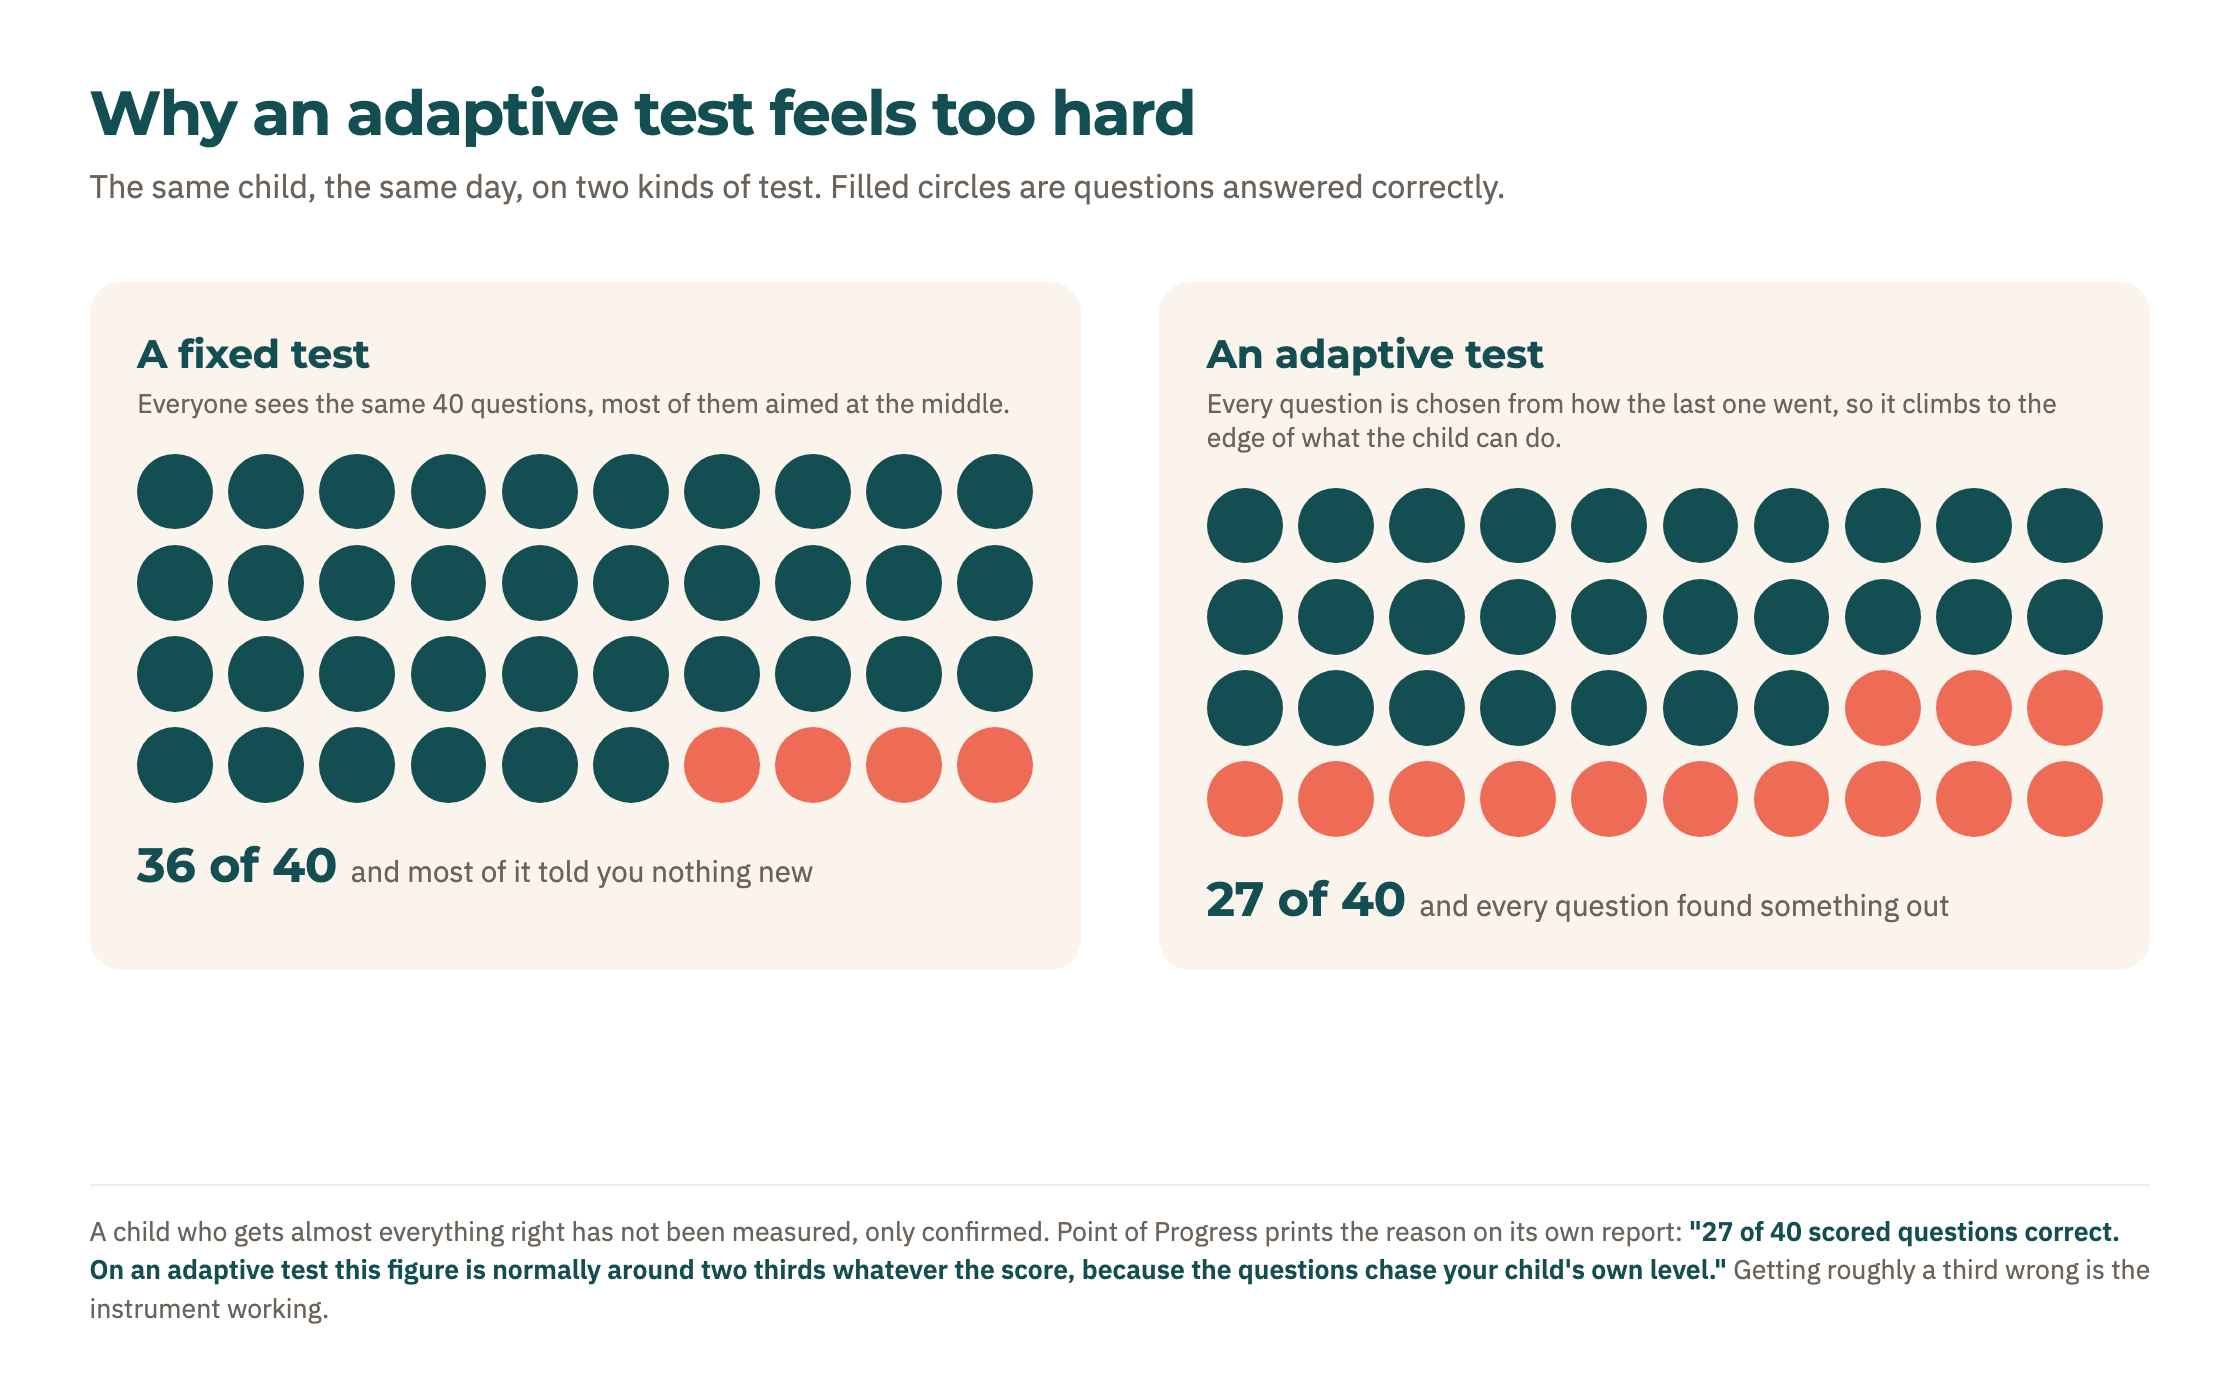
MAP Growth is computer-adaptive. The questions chase the child: answer well and the next one is harder, answer badly and it steps back. The test converges on the edge of what the child can do and stays there.
The practical effect is that almost every child finishes an adaptive test having got roughly a third of the questions wrong, regardless of how able they are. A child who found it uncomfortable has usually been measured properly. A child who found it easy has usually not been measured at all.
What the MAP report does not tell you
- Which skills are weak, at a level you can act on. Instructional areas are broad. Knowing a child is below the line in mathematics does not tell you whether the problem is fractions or coordinate geometry.
- How much of the score is luck. Every score is really a range. Reports lead with a single number, and a child near a cut could land either side of it on a different day.
- What to do next. The report is a measurement, not a plan.
- Anything about grades 9 and 10. The 2025 default cut scores cover grades 3 to 8 only.
What you can do at home
You cannot buy MAP Growth. NWEA licenses it to schools and districts, not to families. You cannot re-run it, and you cannot see the questions your child saw. What you can do is get an independent reading, at a level of detail you can act on.
| Option | What it gives you | Cost | As of |
|---|---|---|---|
| Khan Academy | Free lessons and practice across the curriculum. Good for relearning a topic once you know which topic. | Free | — |
| IXL | Adaptive practice by skill, with a parent dashboard broken down by standard. | USD 9.95 per month, or USD 79 per year, for one subject | June 2026 |
| Kumon | In-centre tutoring, usually two 30-minute sessions a week on one subject. | USD 150 to 200 per month per subject, varying by region | August 2026 |
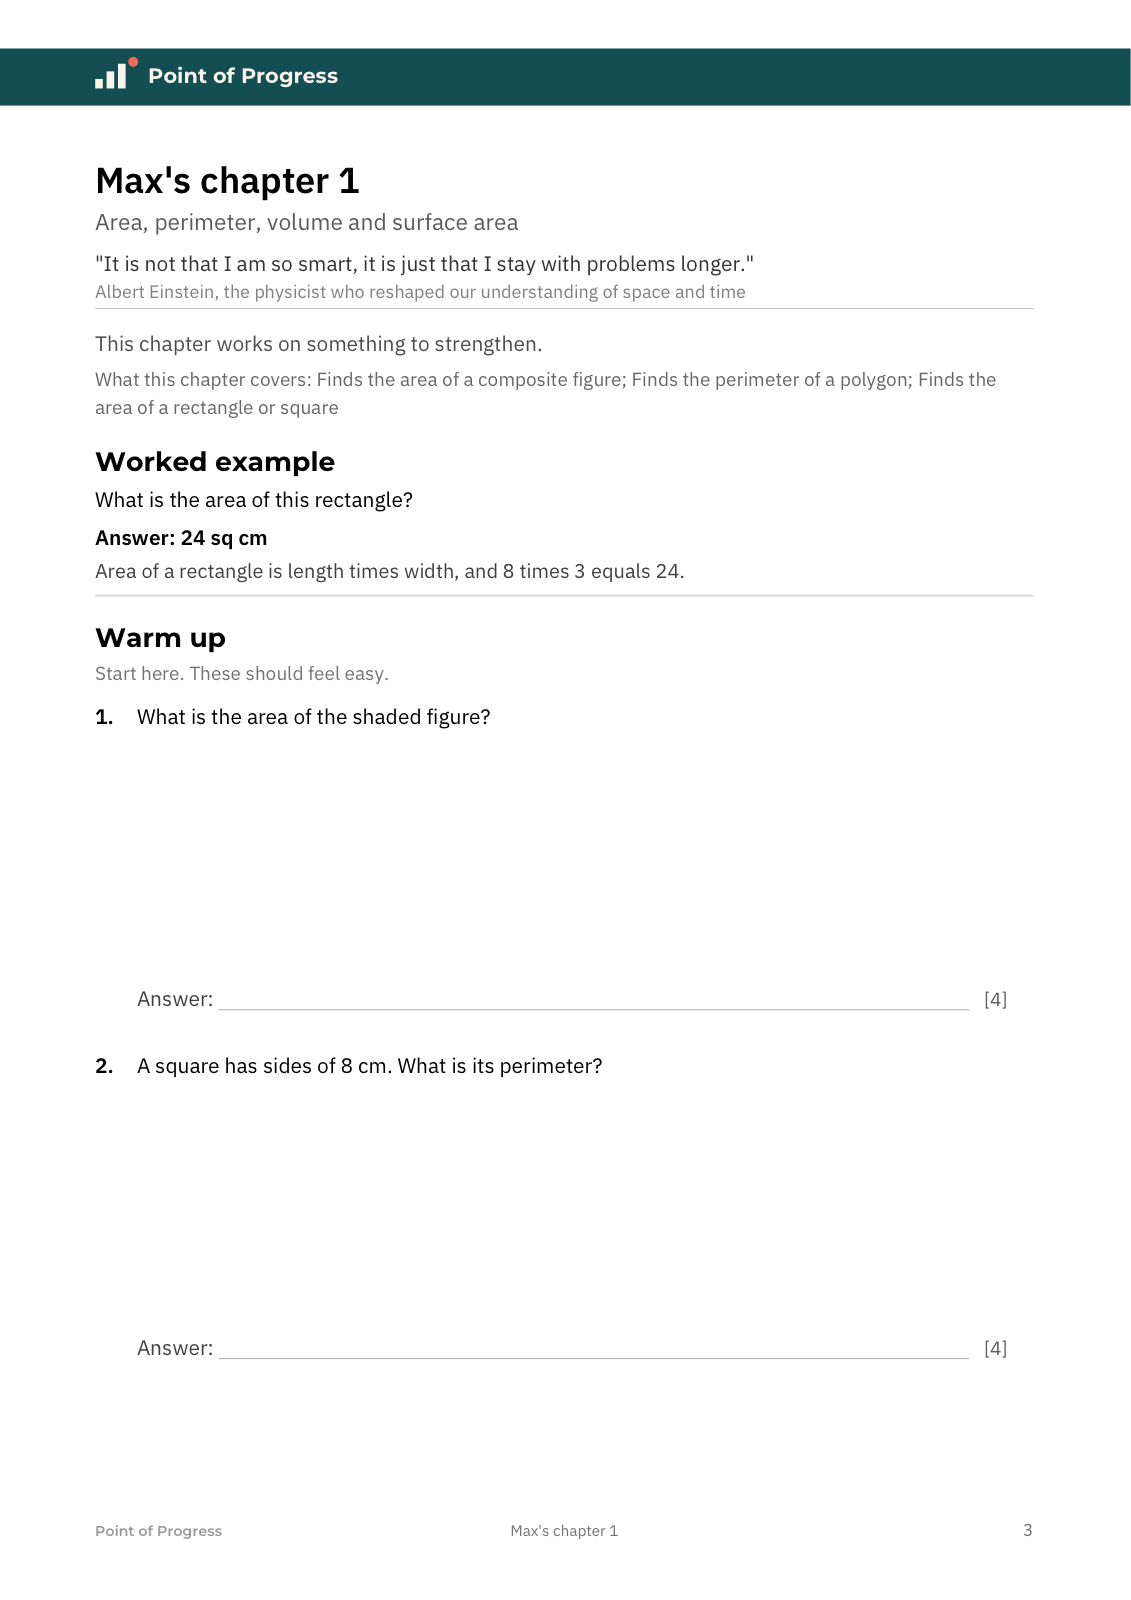
| Point of Progress | An adaptive test in the style of the assessments schools use, a report the same day, and a workbook built from your child’s own answers. | USD 19.99 once, covering both math and reading and writing | September 2026 |
Over a school year that is roughly USD 1,800 to 2,400 for one subject at Kumon, USD 79 for one subject at IXL, nothing at Khan Academy, and a single USD 19.99 payment at Point of Progress. They are not the same product. Tutoring buys a person and a schedule; a diagnostic buys information. Decide which of those you are short of before you decide what to spend.
What to look for in any report you pay for
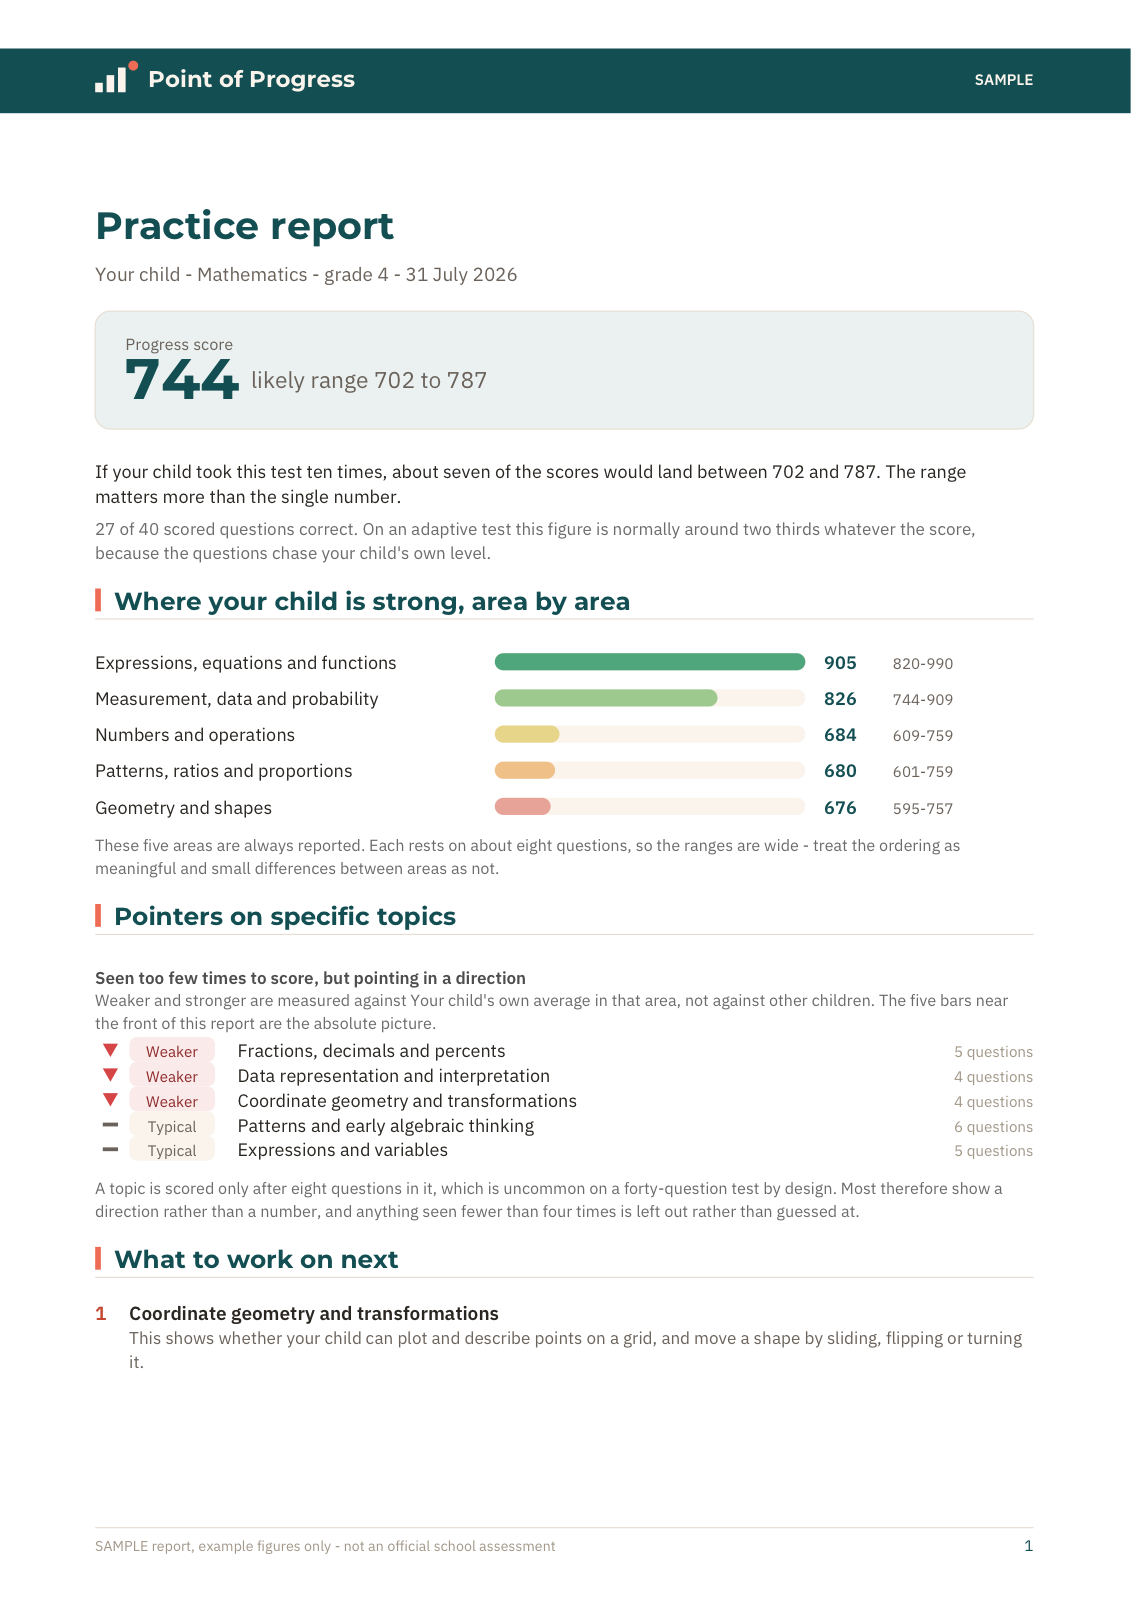
The features worth insisting on are the ones a school report usually omits: a stated range around the score rather than a bare number, performance broken down far enough to name a topic, and an explanation of the test’s own behaviour so the result can be read without alarm.
Is this worth doing?
Probably yes, if
- Your child sits somewhere between the 40th and the 70th percentile, which is exactly the band the 2025 change reclassified.
- The RIT moved and you cannot tell whether that is progress or noise.
- You want to know which topics to work on, not which subject.
- Your child is in grades 3 to 7.
Probably not, if
- Your child is comfortably above the 75th percentile and enjoying school.
- The school has a named intervention running and you can see it working.
- You want someone to sit with your child weekly. That is tutoring, and it is priced accordingly.
Questions parents ask
What is a good MAP score for my child’s grade?
It depends what you mean by good. At the 50th percentile a child is exactly average nationally. Under NWEA’s 2025 default cut scores, Proficient sits between the 61st and 73rd percentile depending on grade and subject, so average is now below proficient in most states. Both statements are true at once, which is why the question is harder than it looks.
Why did my child’s percentile change when their RIT went up?
Because the percentile compares them to other children, and everyone else grew too. A rising RIT with a flat percentile means your child grew at roughly the national rate. That is normal progress, not a stall.
What is the difference between the 2020 and 2025 norms?
The 2025 norms replaced the 2020 set. They reflect a downward shift in achievement and greater variability, so the same RIT can map to a higher percentile than it used to. Schools are still transitioning between the two, so check which set your child’s report uses before comparing across years.
Can MAP Growth predict how my child will do on the state test?
NWEA says explicitly that the default cut scores should not be used that way. Some districts commission their own linking study, which is designed for exactly that purpose and is more reliable than any general rule.
My child got about a third of the questions wrong. Is that bad?
No. That is roughly what an adaptive test is built to produce at every ability level, because the questions climb until they reach the edge of what the child can do.
Does MAP Growth cover grades 9 and 10?
MAP Growth is used beyond grade 8, but the 2025 default cut scores published by NWEA cover grades 3 to 8 only, so the percentile bands in this article stop there.
Can I buy MAP Growth for home use?
No. NWEA sells to schools and districts. Anything advertised to families as MAP Growth is practice material built by a third party, not the assessment itself.
How often should a child be tested?
Schools typically test three times a year. For a parent wanting an independent read, once or twice a year is plenty. Testing more often mostly measures the test.
What to do this week
- Find the percentile, not just the RIT. The RIT alone cannot tell you where your child stands.
- Check which norms the report uses, 2020 or 2025, before comparing with last year.
- If the percentile sits between 40 and 70, understand that this band is where the 2025 change landed hardest.
- If you want topic-level detail, get it from something built to give it. A statewide or district instrument is not designed for that job.
Sources and dates
NWEA, Default Cut Scores for MAP Growth Mathematics and Reading Assessments, August 2025, NWEA Psychometrics and Analytics. Derived from 36 linking studies across 41 states, percentiles from the 2025 MAP Growth norms.
NWEA, 2025 MAP Growth Norms Technical Manual, nwea.org
IXL pricing checked June 2026. Kumon pricing range checked August 2026. Point of Progress pricing September 2026.
MAP Growth and NWEA are registered trademarks of NWEA. This article is independent and is not affiliated with or endorsed by NWEA.
Where does your child actually stand?
Point of Progress is an independent at-home adaptive test for grades 3 to 10. One purchase covers math and reading & writing, and the report comes the same day: the level, what the child can already do, and the specific skills to practise next. It is not an official assessment and no school accepts the result - it is for you.
See what is included →